
By Adam Pagnucco.
Part One examined long-term trends in registration and gubernatorial primary turnout rate by party. Now let’s start examining the geography of Democratic turnout in this year’s primary.
The chart below shows Democratic primary turnout in state legislative districts (in red) and county council districts (in blue).
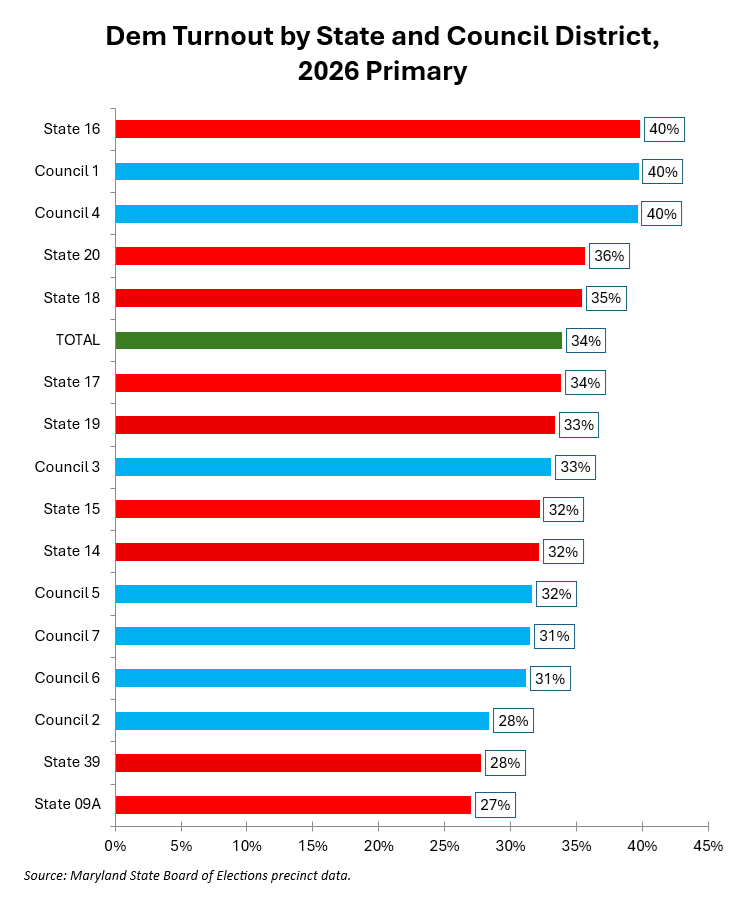
Downcounty districts led the county in turnout, as they always do. Upcounty districts lagged. This is exactly what I expect to see in a MoCo Democratic primary.
Now let’s zero in on local areas, which are defined in my methodology post.
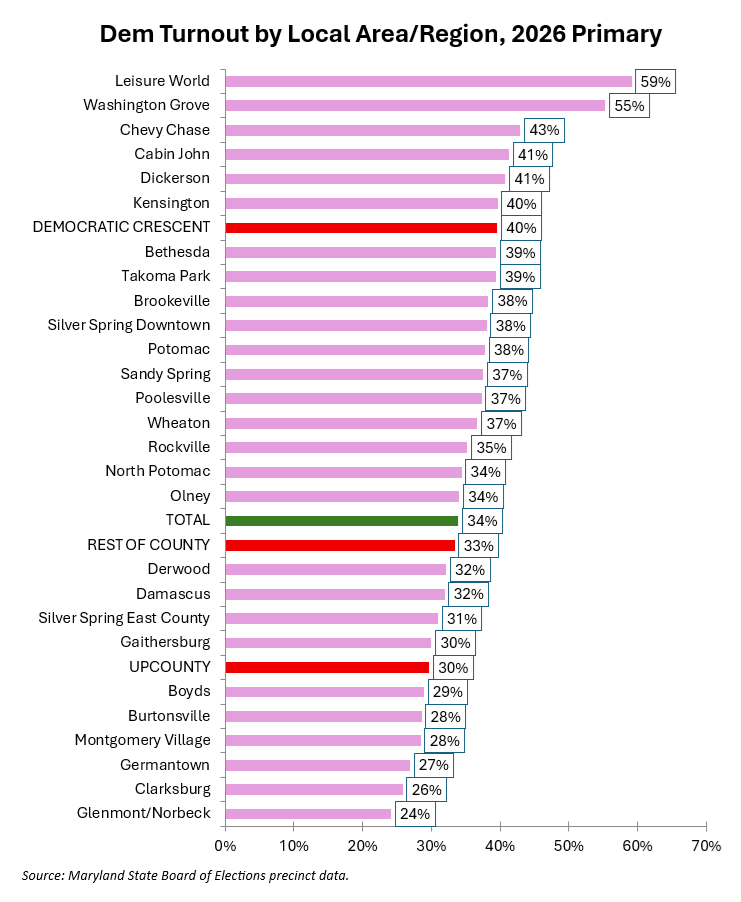
With the notable exception of Leisure World, most of the turnout leaders are located in or near the Beltway, the area I define as the Democratic Crescent. These are the areas that elected Jamie Raskin to Congress ten years ago and they have an outsized impact on MoCo politics. Many Upcounty areas lag. I have seen this pattern in every MoCo election I have analyzed for twenty years.
Consider this fact. The Democratic Crescent (Downcounty) has less than a quarter of the county’s population. This year, nearly a third of the votes in the Dem primary came from that region. Upcounty has roughly a third of the county’s population but it cast about a quarter of the votes in this year’s Dem primary. There are two reasons for this pattern: Democrats are most common in Downcounty and the ones who live there have higher turnout rates than the ones who live in Upcounty.
After decades of this disparate geography, the Downcounty/Upcounty divide is about as close to an immutable law of MoCo politics as it gets. (Another one is that seniors vote at far higher rates than younger people.) We shall see if this ever changes.
Next: turnout by race.