
By Adam Pagnucco.
Part One examined long-term trends in registration and gubernatorial primary turnout rate by party. Part Two looked at the geography of Democratic turnout in this year’s primary. Now let’s consider race.
The State Board of Elections does not collect data on race by voters. Various proprietary sources like MDVAN and commercial email firms estimate it but I have found their numbers a bit wobbly in my past use. My approach is to gather racial data on population by precinct and associate it with voting numbers. I detailed how I did that in my methodology post.
The chart below shows Democratic primary turnout rate in the 25 precincts with the highest population concentrations of the four major racial groups: Asian, Black, Latino and White. You can learn about the locations of each of these precinct groups here.
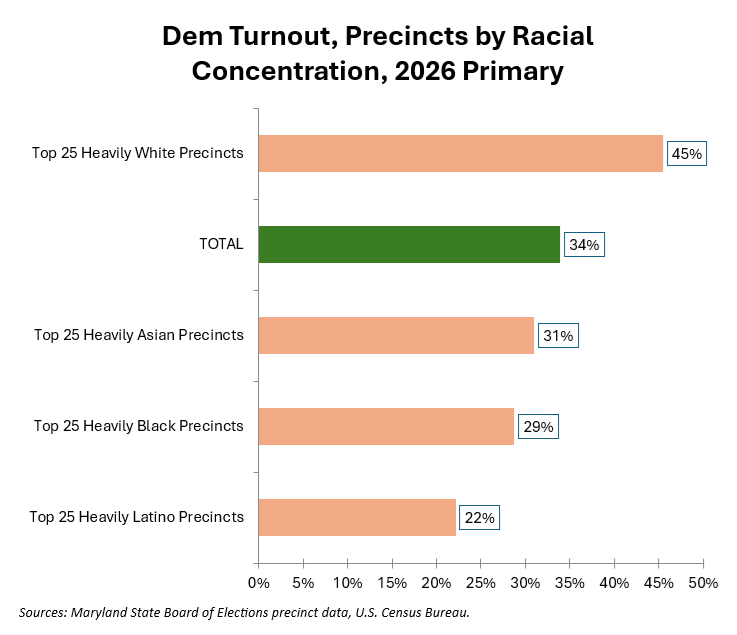
Heavily White precincts led the way in turnout rate. Think back to the local area turnout leaders in Part Two, which included places like Leisure World, Bethesda, Chevy Chase, Dickerson, Cabin John and Washington Grove. These areas have much higher White population percentages than most of MoCo. Heavily Latino precincts lagged. This tracks with low turnout rates in heavily Latino areas like Glenmont/Norbeck and Montgomery Village.
Now let’s look at turnout rates compared to population percentages for each racial group. We will start with Asians. The chart below shows Dem turnout rates for four groups of precincts, each within a different range of Asian population percentage. I selected the cutoff percentages to make each of these four groups roughly comparable in size.
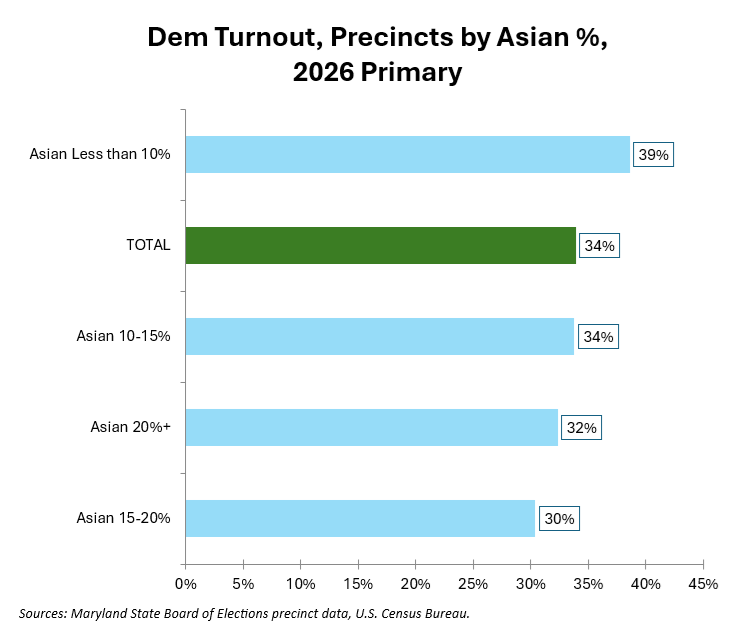
Generally, precincts with low Asian population percentages tend to have higher turnout rates, but the effect is not strong. Note how precincts with the highest Asian percentage (20% or more) had slightly higher turnout than the ones that were 15-20% Asian.
The chart below shows Dem turnout rates in precincts by Black population percentage. Again, I selected the cutoff percentages to make each of these four groups roughly comparable in size.
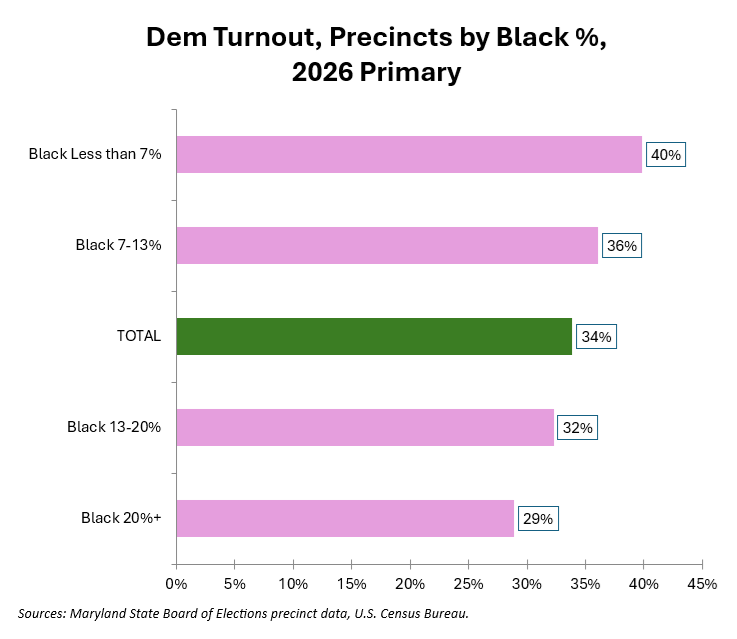
As Black population percentage rises, turnout falls. The effect is a bit more noticeable here than it is for Asians.
We will have more in Part Four.