
By Adam Pagnucco.
Part One listed Will Jawando’s assets and liabilities. Part Two looked at Andrew Friedson. Part Three examined Evan Glass. Part Four recited a timeline of key events in the election cycle. Parts Five and Six broke down Jawando’s performance.
Let’s start profiling the performance of Council Member Andrew Friedson. The chart below shows his percentage of the primary vote by state legislative and county council district. Friedson finished first in districts represented by dark blue bars and second in districts represented by light blue bars. He finished third in State Legislative District 20, shown in a white bar.
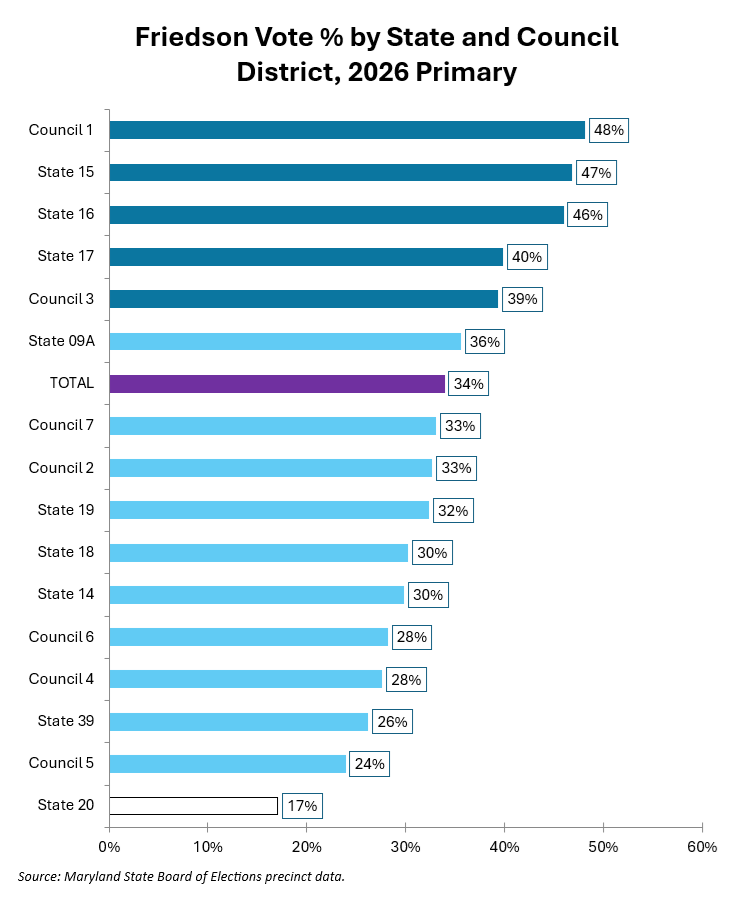
Friedson was endorsed by seven of nine state senators but only won three state legislative districts, which tended to be located in or near his council district. He won his own council district as well as Council District 3 (Gaithersburg-Rockville). His endorsement by District 2 Council Member Marilyn Balcombe and District 7 Council Member Dawn Luedtke did not stop Jawando from winning in their districts.
Now let’s look at Friedson’s performance by region and local area. See my methodology post for definitions. Again, Friedson finished first in areas represented by dark blue bars, second in areas represented by light blue bars and third in areas shown in white bars.
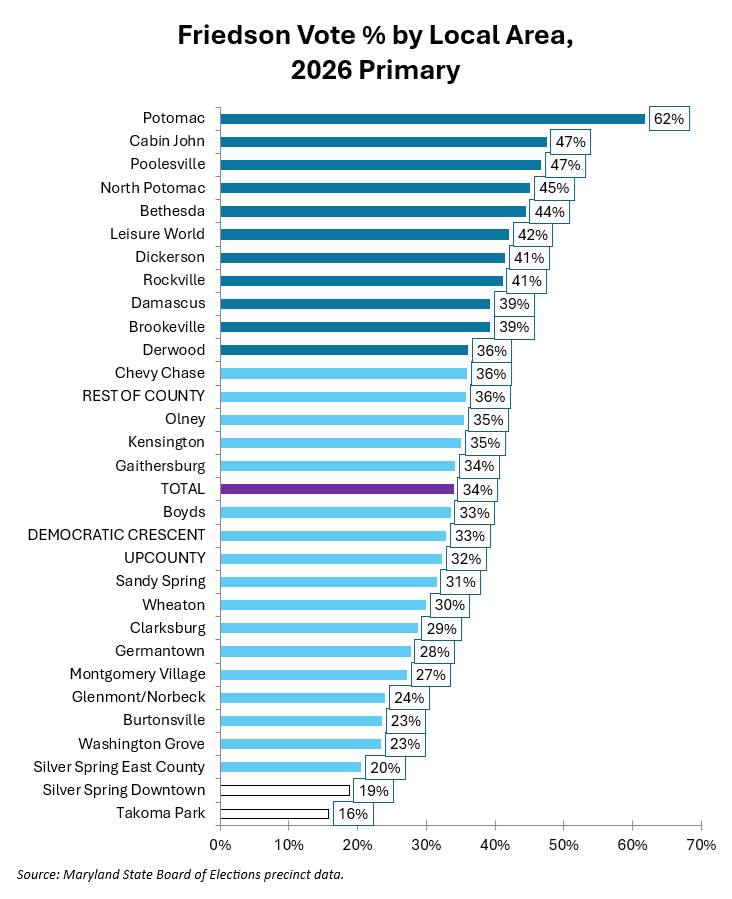
Friedson’s best areas tend to be those inside his district along with Poolesville, which he once represented, and Leisure World, where voters are unhappy about tax increases. He did poorly in Jawando’s best areas, including Downtown Silver Spring, Takoma Park and the Route 29 corridor (an important concentration of Black Dems).
Additionally, two things stand out to me. First, while Friedson won his own council district, he got less than a majority there (48.1%). As a district-based candidate, Friedson needed to crush his opponents in his home base, and he did not meet that standard. Second, Friedson lost Chevy Chase to Jawando (37.4% to 35.8%). I believe both of these events are related to a post I wrote last October on whether Friedson’s aggressive advocacy for housing was going to cost him with development opponents inside his district.
Let’s examine Friedson’s results in the 25 precincts with the highest population percentage of Asian, Black, Latino and White residents. My methodology post contains information on where these precincts are located.
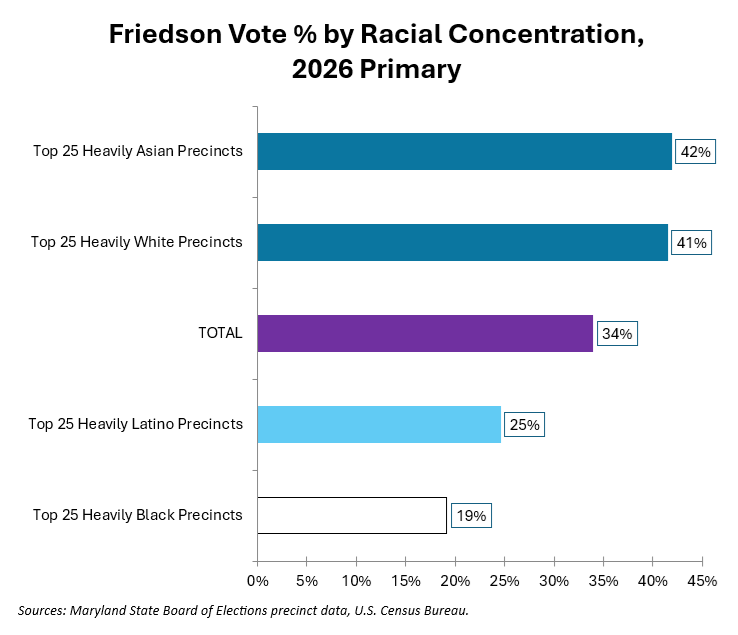
Friedson finished first in heavily Asian and White and precincts, second in heavily Latino precincts and third in heavily Black precincts. Among the latter group, these are the percentages: Jawando 55.9%, Evan Glass 21.0% and Friedson 19.1%.
Here are two additional notes on Friedson’s performance.
First, among precincts with at least one synagogue, Friedson received 43.9% of the vote, Jawando received 32.2% and Glass received 21.0%. In precincts without a synagogue, Jawando received 41.8% of the vote, Friedson received 31.8% and Glass received 22.3%. This suggests that Jewish voters were an asset for Friedson.
Second, inside the Wootton High School cluster (part of which is in Friedson’s district), Friedson received 52.1% of the vote, Jawando received 24.5% and Glass received 19.4%. Friedson’s statement criticizing MCPS’s redistricting process is featured on the Save Wootton coalition’s website.

We will have more on which factors were statistically associated with Friedson’s performance next.