
By Adam Pagnucco.
Part One covered the methodology of this series. Part Two looked at total employment. Part Three examined federal government employment. Part Four reviewed private sector employment. Part Five looked at construction employment. Part Six examined establishments. Part Seven reviewed real total wages paid. Now let’s look at real total wages paid per job, a proxy for average salaries.
Let’s start by comparing MoCo to its neighbors on total wages per job last year.
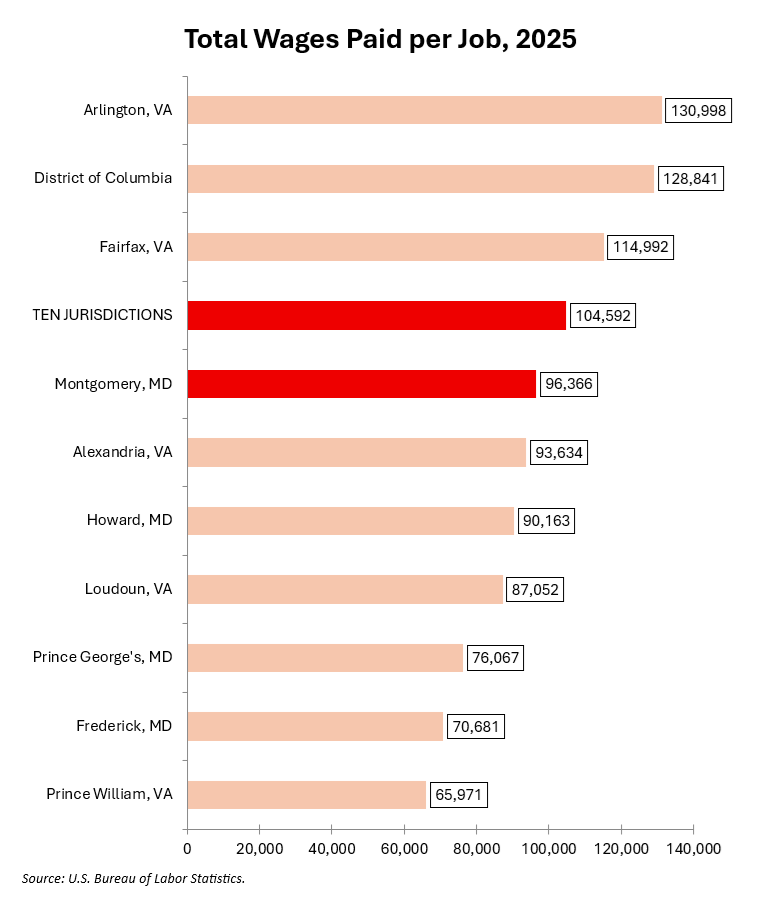
MoCo trailed Arlington, D.C. and Fairfax on this measure but was close to the regional average. The county’s average no doubt conceals huge variation between employees, but nonetheless, we cannot be considered a low wage jurisdiction.
Now let’s look at MoCo’s real total wages paid per job since 2001. Nominal wages have been adjusted by the Washington-Arlington-Alexandria CPI-W and are expressed in 2025 dollars.
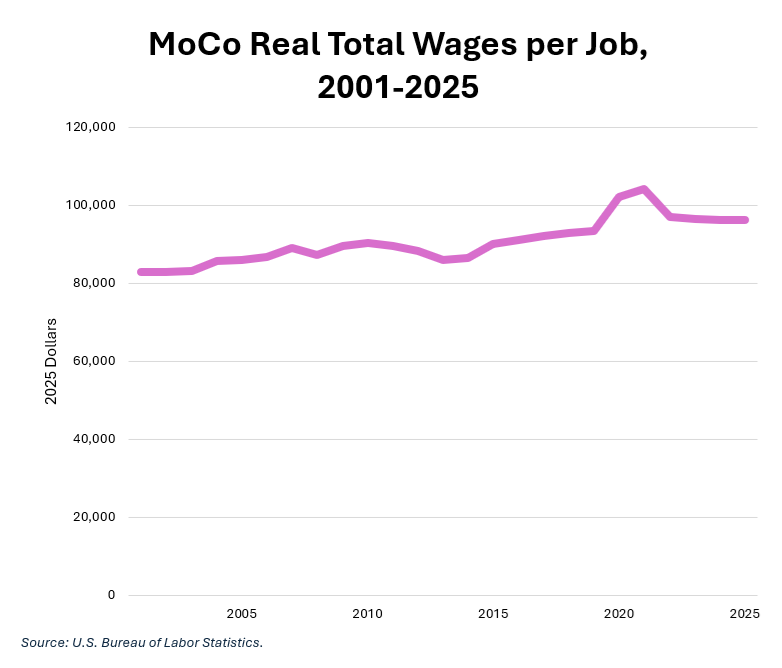
This measure showed slow, steady growth for most of the period. It spiked in 2020 and 2021 because the pandemic disproportionately eliminated lower wage jobs (such as those in the restaurant industry). It has stagnated since then.
The chart below shows changes in real total wages paid per job by jurisdiction last year.
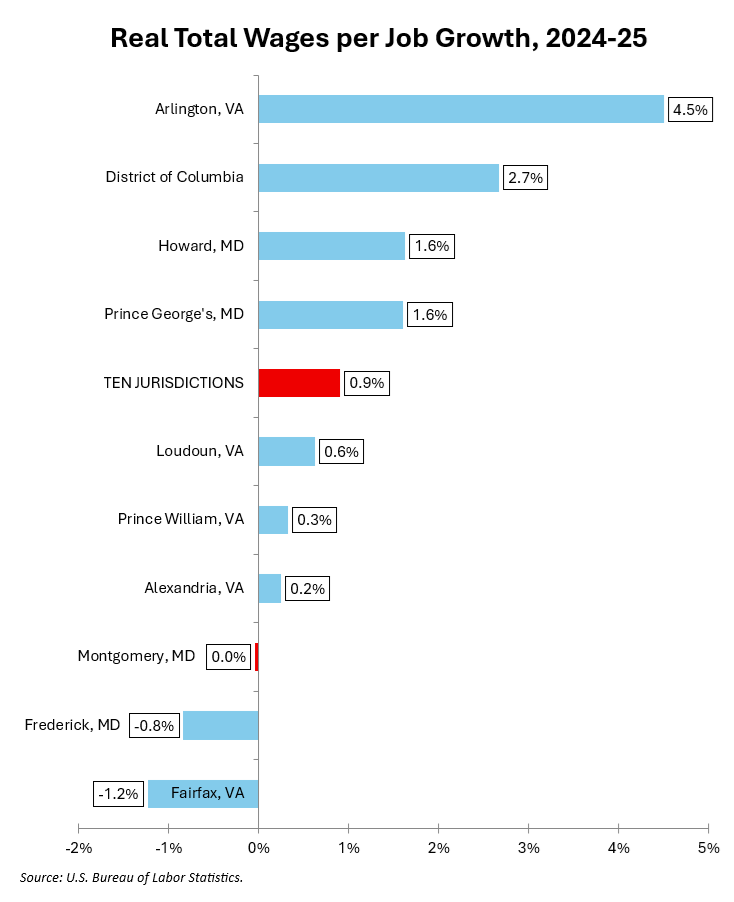
We saw zero average wage growth last year. Only Frederick and Fairfax did worse.
The chart below shows 2025 real total wages per job as a percentage of 2019. It measures change in this stat from before the pandemic.
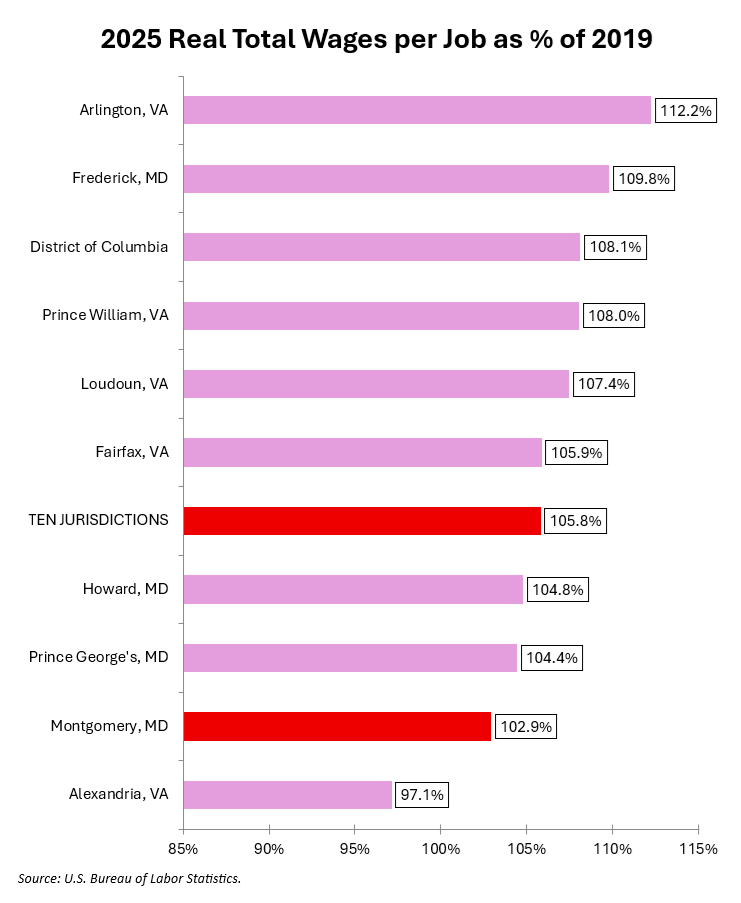
MoCo’s average wage is above the pre-pandemic level but all of our neighbors except Alexandria have outperformed us.
Finally, the chart below shows the change in real total wages per job between 2007, the year before the Great Recession, and 2025.
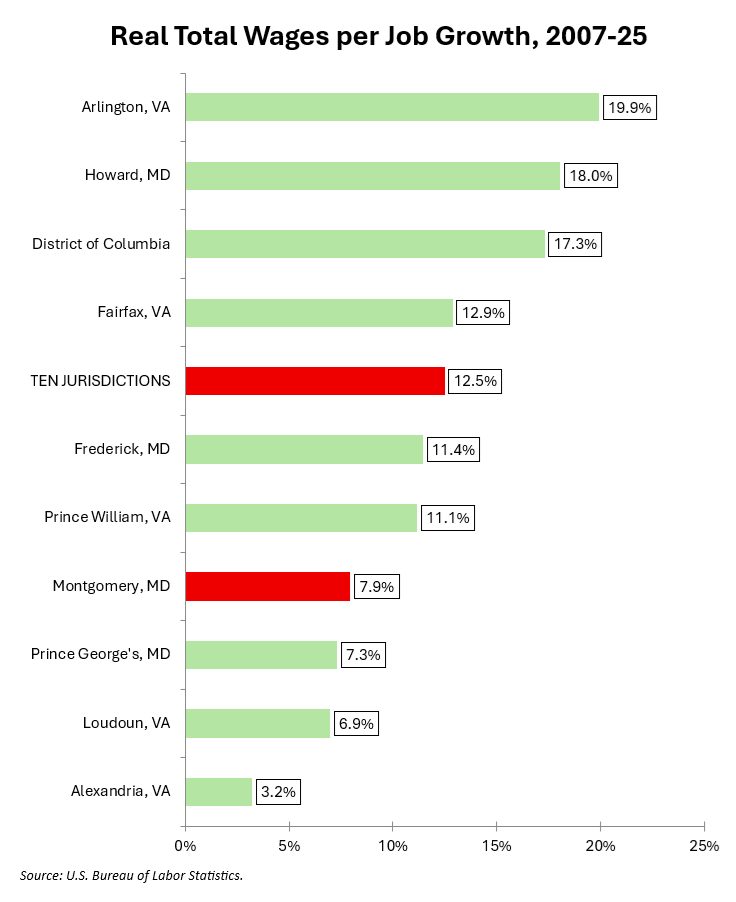
We are below the region’s average but not one of its worst performers. That is actually superior to our performance on most economic indicators in this series.
Next: we conclude.